The spring update of SEO Effect is live, and it is a big one that – by popular demand – includes:
- faster keyword research; labels and favourites for keywords.
- introduction of a more accurate ‘12 month average traffic share ’ KPI.
- monitoring of your link profile based on 2 linkdatabases
- link prospect research enriched with more link data and contact data
In a series of four posts, we’ll give you a more detailed update of each function. Last blogpost was about Keyword research improvements . This post is about the more accurate ‘12 month average traffic share’ KPI.
Part 2: more accurate KPI ‘12 month average traffic share’
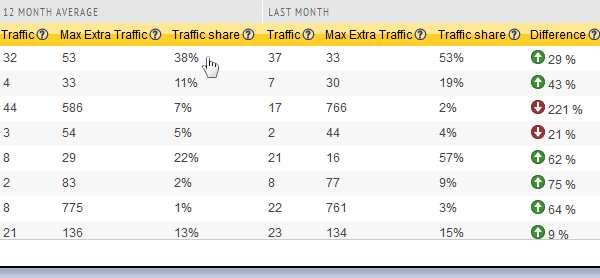
As an addition to the monthly ‘traffic share’ we now also measure a new Key Performance Indicator: the ‘12 month average traffic share’. The traffic share of a keyword indicates what part of the maximum number of searchers actually make it to your site.
- With ‘Monthly traffic share’ we compare exact traffic data with traffic form your anaytics account.
- With ‘12 month average traffic share’ we compare the rolling average over 12 months of both values.

You will find these new metrics especially in “Keyword research” because there you want to make the best possible decisions on what keywords to optimize for. In “Trends” you’ll currently find the monthly values. In a future version we’ll present both. But also in keyword research you can still have peak at monthly data. In the “x-ray” of each keyword you can review all data form the last twelve months.
Benefits of measuring over a years worth of data.
- More reliable data
- Make better decisions for seasonal keywords
More reliable data
We noticed that small or ‘young’ websites with little traffic show fluctuations in organic search over subsequent months. That also gives peaks and lows in monthly traffic share which hinders the decision making about whether or not to optimize for those keywords. This effect can also occur in larger sites when you try to get traffic from a new niche. Using 12 month average values gives you a more realistic picture of what is going on in your site. This allows you to make better decisions about how to target your SEO effort.
Assess seasonal keywords outside the season
 By using 12 month average values, you can properly assess seasonal keywords when researched off season.
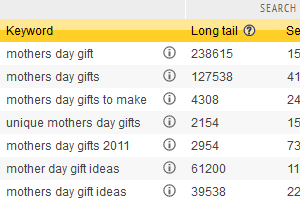
Example mothers day
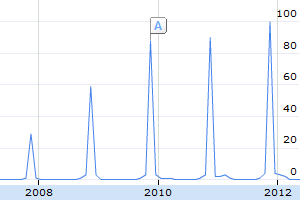
It is September and mother’s day is long gone (somewhere in May) and you are researching the search volume for “mother’s day gift”. Your traffic of the previous month (august) will be low or even zero. Also the traffic volume for that word will be very low. Calculating a traffic share can turn out to be lower or higher that it would be in April or May, but that really does tell you very much.
‘Mother’s day 12 month average traffic share
 Now in the same case with a 12 month average. Your traffic share will be based on the average search volume over the last twelve months and your site’s traffic over the same period. This includes the peak in May. It will give you a better insight in what to expect from investing some hours into site optimization for that keyword.
Where to find the 12 months average traffic share?
You’ll find the new data in the ‘Keyword research’ tool an din de -x-ray. You find them also in the table in ‘Trends’ > ‘Traffic share’. Soon we will release improved graphs in which both values will be shown.
Like what you read?
Help us spread the word: Like, G+, LinkedIn Share or Tweet about the blogpost. Also try the spring update now: login or create an account

